How climate change is already altering oceans and ice, and what’s to come
Seas will continue to rise and glaciers melt even if nations curb greenhouse gas emission
Climate change creates a whole world of problems, from melting glaciers (a tidewater glacier in southeast Greenland in the summer of 2018 shown) to the ocean floor — and it’s probably only going to get worse, according to a new IPCC report.
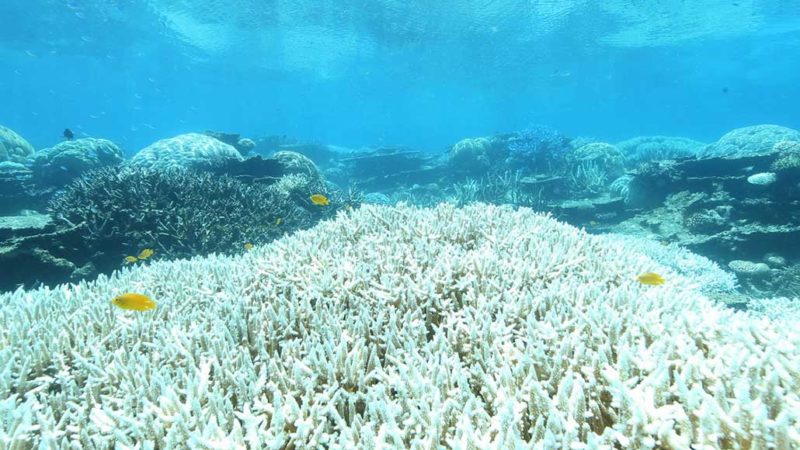
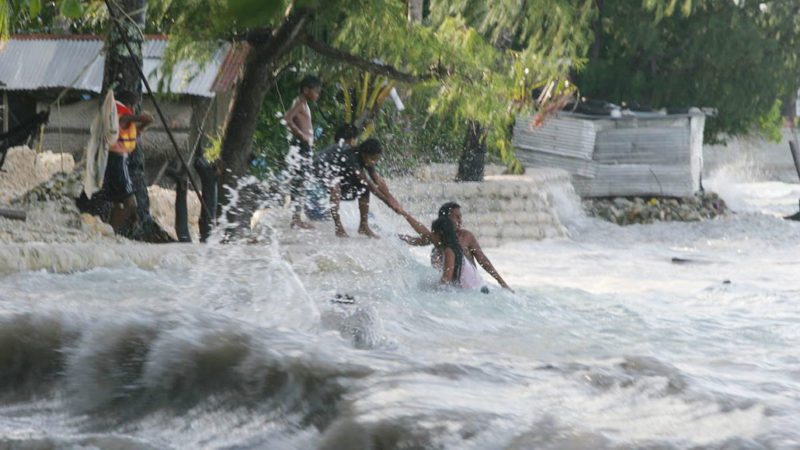
Polar caps quickly losing ice. Chalky coral reefs. Stronger storms that devastate islands and cities, claiming lives and destroying homes.
Those aren’t speculations about what our world faces in a warmer future. Those are climate change impacts happening now — and set to worsen, according to a new report by the U.N. Intergovernmental Panel on Climate Change.
The report, a summary of which was released on September 25, is the panel’s first comprehensive update on how human-driven climate change is upsetting Earth’s oceans and frozen regions, or cryosphere. Just how severe things get will depend on whether countries rein in climate-warming greenhouse gas emissions, or continue pumping them into the atmosphere.
The report focuses on forecasts for two potential scenarios: One involves curbing carbon emissions to limit global warming to around 2 degrees Celsius above preindustrial levels. (The world is already more than halfway there, having warmed by 1.1 degrees C since 1900, according to a report by the World Meteorological Organization published September 22.) In another, high-emissions scenario, pollution continues apace, potentially warming the world by about 4 degrees C.
Science News took a look at the report’s predictions for how changes to Earth’s oceans and ice will impact societies and our natural world, along with the latest science on where things stand today.
Glaciers and ice sheets
Already, glaciers and ice sheets are shrinking, and some are shrinking fast. The Greenland ice sheet lost an average 278 billion tons of ice per year from 2006 to 2015. That amount of water alone is enough to cause average global sea levels to rise about 0.77 millimeters per year. And on July 31, a record-breaking 57 percent of the sheet showed signs of melting . Meanwhile, the Antarctic ice sheet lost an average 155 billion tons per year, or roughly enough to raise seas by an average 0.43 millimeters per year .
Glaciers from the Himalayas to Chile and Canada on average have lost 220 billion tons per year , threatening the safety and livelihoods of millions of people who rely on melt water to meet their water needs .
Greenland and Antarctica have dominated ice melt contributing to rising sea levels. Even with global action against climate change, the two massive ice sheets are still expected to contribute a combined 11 centimeters or so of sea level rise by 2100. But without that effort, average sea levels could rise up to some 27 centimeters by 2100 just from the melting in Greenland and Antarctica, the IPCC report says.
Glaciers could add nine to 20 centimeters to that rise, depending on emissions. And regions with mostly smaller glaciers, like Central Europe, Scandinavia and the Andes, could lose more than 80 percent of their current ice mass by the end of the century if emissions continue business-as-usual. Glacier runoff, regardless of emissions scenarios, would peak by the end of the century and then decline, potentially leaving less water available for future generations.
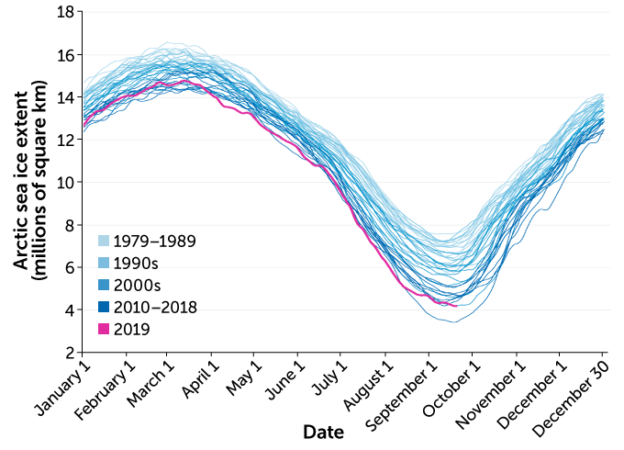
Aside from the ice that sits atop mountains and landmasses, thick ice blankets the Arctic Sea, with more expansive coverage in the Northern Hemisphere’s winter. Scientists say the white ice plays an important role in reflecting sunlight away from Earth, which keeps the Arctic from getting too hot. But that ice is shrinking. Although the sea ice expands and contracts over the course of a year, the overall amount of ice has steadily declined since 1979, the IPCC says.
So much melting has left little ice that has endured for at least five years (such hardened ice is expected to be sturdier than single-season ice). In fact, as of last year, the fraction of sea ice older than five years had declined by about 90 percent since 1979, the report says. In Antarctica, meanwhile, there’s still a lot of uncertainty about the state of sea ice now and in the future.
Vanishing ice
The lid of sea ice that covers the Arctic Ocean (which expands in the winter and contracts in the summer) has been steadily shrinking, satellite records show. The 2019 minimum extent, reached September 18, is tied with two other years for the second lowest amount of ice cover: 4.15 million square kilometers.
Change in Arctic sea ice extent, 1979–2019

In a low-emissions scenario that limits global warming to 1.5 degrees C, the probability of September being ice free after the summertime melt is a mere 1 percent. But at 2 degree C warming, that risk jumps to 10 to 35 percent. The loss of sea ice takes away habitat for Arctic mammals and birds. And less ice also means more exposed water, which is dark and absorbs more sunshine.
Permafrost thaw
Permanently frozen soil, which has carbon trapped in the ground, is warming to record levels, increasing an average of 0.29 degrees Celsius from 2007 to 2016, the IPCC says. Arctic and other northern permafrost is estimated to contain almost twice as much carbon as is in the atmosphere. A thaw in permafrost could release trapped carbon dioxide and methane into the air — though it’s not yet certain if that’s happening today .
But thaw it will, the report says. By 2100, the expanse of Earth’s permafrost could decrease by around 24 percent in a low-emissions scenario, or 69 percent in a high-emissions future. Under that scenario, permafrost could exhale tens to hundreds of billions of tons of carbon, in the form of CO2 and methane, into the atmosphere by 2100, possibly making global warming even worse. Thawed regions might see more plant growth, pulling some of that carbon back into the soil — but not nearly enough to make up for carbon releases.
Ocean warming
So far, oceans have swallowed up more than 90 percent of the climate’s excess heat, and as a result have been warming up. Marine heat waves, which scorch coral reefs and help boost the frequency of toxic algal blooms , are getting more severe and lasting longer than they did decades ago . And human-caused climate change may have been responsible for nearly 90 percent of these events between 2006 and 2015, the IPCC says.

Those hot waters — which will get even hotter under any emissions scenario — are also helping to drive many ocean-dwelling animals to move toward cooler digs near the poles . But in new environments, migrant animals can interfere with local food webs . Climate-driven shifts in ocean species may have already hurt overall catch potential for the world’s fisheries .
By 2100, ocean surfaces are expected to absorb five to seven times more heat than they have since 1970 under a high-emissions scenario. And heat waves would be 50 times more frequent than they were in 1900. In a low-emissions scenario, heat waves would be 20 times more frequent by 2100 than in 1900.
Ocean acidification
It’s not just heat that oceans take in. The world’s biggest water bodies also have absorbed an estimated 20 to 30 percent of the excess CO2 in the atmosphere since the 1980s, causing seawater to become more acidic .
That’s going to continue, the IPCC says. In a high-emissions scenario, the pH of the ocean surface is expected to drop by around 0.3 pH points (on a scale of 14) by the end of the century. That acidity may make it more difficult for creatures like snails, crabs and shrimps to build their shells and impairs the function of tiny algae that ferry carbon to the deep ocean. Acidity can also deplete seawater of the minerals that corals use to build their exoskeletons .
Sea level rise
Sea levels are rising faster with time. And that swell is going to continue under any emissions scenario, the IPCC says. From 2006 to 2015, sea level rose about 3.6 millimeters per year, about 2.5 times as fast as sea level rise from 1901 to 1990. Melting ice sheets and glaciers are primarily to blame.

With higher sea levels come greater flooding and coastal erosion. Encroaching seawater can also shrink habitats and force species along coastlines to relocate — if they can. Nearly half of coastal wetlands already have disappeared over the last century, due partly to higher seawater.
In a low-emissions future, sea level rise could reach an average 4 millimeters per year in 2100, compared with 15 millimeters per year in a high-emissions future. Higher sea levels are also affecting the risk of certain disasters, such as coastal flooding. Extreme events related to high seas that were once rare — happening once a century — could happen at least once per year in many places by 2050, especially in the tropics. That puts coastal areas and small islands in even greater danger .
Extreme weather
Human-driven climate change has likely increased the amount of wind and rain associated with some tropical cyclones already . These storms will probably get more intense, with bigger storm surges and more rainfall, even if emissions are limited. Scientists aren’t yet sure whether tropical cyclones will become more frequent, though.
What could become more frequent, and possibly less predicable, are extreme El Niño and La Niña events. Extreme El Niños may hit twice as often in this century compared with the last, the report says. These weather disturbances are also expected to become more hazardous, causing dryer droughts and more torrential downpours around the world.


Follow us